Honoring one of their own

Posted in Articles, History, Media Archive, United States on 2013-11-14 04:04Z by Steven

Honoring one of their own

Bucks County Courier Times
Levittown, Pennsylvania
2013-11-13

Phil Gianficaro, News columnist

The inscription on the small old tombstone in the shadow of the majestic oak tree is practically illegible. Weathered and darkened by 148 years, the tablet-shaped marker pales in comparison to others that are more ornate in the Hatboro Baptist Church Cemetery. A noteworthy war veteran from Hatboro, it would seem, deserves a more appropriate remembrance.

Now he has one.

Near that barren oak tree this week, they gathered on a sunny Veterans Day morning to honor one of their own, Barclay J. Stagner, the town’s first man of color to serve in the Civil War. A new tombstone, supplied by the Veterans Administration, was dedicated to Stagner and placed several feet from the old stone and beside the gravestone of his mother, Elizabeth.

“This is a special, long overdue honor,” said David Shannon, Hatboro historian and curator of the cemetery, before a small gathering at the graveside. “While many in the congregation were aware of Barclay, we were intent on letting the community know he existed.”…

…Stagner was born during the time of slavery. He wasn’t a member of the Hatboro Baptist Church, but was a close friend of Union Army Gen. William Davis, who was. That relationship, combined with his light skin color and blue eyes that belied his race, likely helped Stagner get accepted into the Union Army at a time before blacks were recruited or permitted to enlist.

“We don’t know if Barclay was black or what used to be called mulatto, or a mixed race,” Shannon said. “He was likely of mixed race. But because he wasn’t dark skinned, they probably didn’t know.”

Stagner became a sergeant in the 6th Pennsylvania Volunteer Cavalry, and fought in the Battle of Gettysburg. Upon his re-enlistment as a veteran volunteer, he rose to the rank of corporal. He died in Virginia at age 28 on Jan. 3, 1865, and his remains were sent to Hatboro to be interred…

Read the entire article here.

Tags: , , , , , ,

Being Black: It’s not the skin color

Posted in Articles, Arts, Autobiography, Identity Development/Psychology, Media Archive, Social Science, United States on 2013-11-13 16:37Z by Steven

Being Black: It’s not the skin color

Philadelphia Weekly
2013-11-13

Kennedy Allen et al.

Drexel prof Yaba Blay’s striking new photo book “One Drop” explores how a wide range of different skin tones affects Americans’ personal identities. In  this PW excerpt, eight Philadelphia-area residents of mixed heritage concur: However light they may be, they’re still most certainly Black. Our own Kennedy Allen agrees…

Growing up in Mt. Airy, an ethnic and economically diverse neighborhood, instilled within me a level of acceptance and tolerance regarding my fellow man that, confoundingly, many didn’t seem to share. I was one of seven Black kids in a class of 42. Because I spoke English properly and preferred rock to rap, I was deemed “White girl” by my racial peers—a label that haunted me for what felt like eons. I knew I wasn’t White, nor did I ever have the urge to be, outside of wishing my hair would blow in the wind like some of the girls in my class. Flash-forward to my final years of high school, in a black school where I was the “light-bright girl who talks White.” Dark-skinned people still sneer at me, somehow assuming that I believe myself to be “better” than they are because of my buttered-toffee skin tone.

When all is said and done, racial or ethnic identity rests upon the individual and their experiences. I identify myself as a black woman who happens to have Irish and Cherokee lineage. What of all the others who identify as black, but appear otherwise? Scholar and activist Arturo Schomburg, whose extensive collection of books and historical records of African people’s achievements eventually became the famed Schomburg Center for Research in Black Culture in Harlem, N.Y., identified as an Afro-Puerto Rican. (In fact, his passion for gathering all those documents was born after a grade-school teacher told him that black people had no history, heroes or accomplishments.) Would Schomburg’s experience be less valid because it fails to meet some homogenous notion of Blackness? Who has the right to determine these standards in the first place? And in an age of global interconnectedness and the instant, worldwide exchange of information and ideals, why does it still even matter?

Dr. Yaba Blay wondered some of the same things. A first-generation Ghanian-American and the co-director of Drexel’s Africana studies program, Blay has spent the past two years gathering vibrant portraits and intimate stories from nearly 60 individuals across the country in an attempt to shine some light upon questions of racial ambiguity and legitimacy. Those portraits now comprise a new book that she’s edited and published, (1)ne Drop: Shifting the Lens on Race—as well as an exhibit of the same name, currently on display at the Painted Bride Art Center

Read the entire article and eight subject profiles from the book here.

Tags: , , , , , , , , , , , , , , , ,

Skin pigmentation, biogeographical ancestry and admixture mapping

Posted in Anthropology, Articles, Health/Medicine/Genetics, Media Archive, United Kingdom, United States on 2013-09-13 01:01Z by Steven

Skin pigmentation, biogeographical ancestry and admixture mapping

Human Genetics
Volume 112, Issue 4 (April 2003)
pages 387-399

Mark D. Shriver, Professor of Anthropology
Pennsylvania State University

Esteban J. Parra
Department of Anthropology
University of Toronto at Mississauga

Sonia Dios
Department of Anthropology
Pennsylvania State University

Carolina Bonilla
Department of Anthropology
Pennsylvania State University

Heather Norton
Department of Anthropology
Pennsylvania State University

Celina Jovel
Department of Anthropology
Pennsylvania State University

Carrie Pfaff
Department of Anthropology
Pennsylvania State University

Cecily Jones
National Human Genome Center
Howard University, Washington, D.C.

Aisha Massac
National Human Genome Center
Howard University, Washington, D.C.

Neil Cameron
Takeway Media, London

Archie Baron
Takeway Media, London

Tabitha Jackson
Takeway Media, London

George Argyropoulos
Pennington Center for Biomedical Research, Baton Rouge, Louisiana

Li Jin
Department of Environmental Health
University of Cincinnati, Cincinnati, Ohio

Clive J. Hoggart
Department of Epidemiology and Population Health
London School of Hygiene and Tropical Medicine

Paul M. McKeigue
Department of Epidemiology and Population Health
London School of Hygiene and Tropical Medicine

Rick A. Kittles
National Human Genome Center
Howard University, Washington, D.C.

Ancestry informative markers (AIMs) are genetic loci showing alleles with large frequency differences between populations. AIMs can be used to estimate biogeographical ancestry at the level of the population, subgroup (e.g. cases and controls) and individual. Ancestry estimates at both the subgroup and individual level can be directly instructive regarding the genetics of the phenotypes that differ qualitatively or in frequency between populations. These estimates can provide a compelling foundation for the use of admixture mapping (AM) methods to identify the genes underlying these traits. We present details of a panel of 34 AIMs and demonstrate how such studies can proceed, by using skin pigmentation as a model phenotype. We have genotyped these markers in two population samples with primarily African ancestry, viz. African Americans from Washington D.C. and an African Caribbean sample from Britain, and in a sample of European Americans from Pennsylvania. In the two African population samples, we observed significant correlations between estimates of individual ancestry and skin pigmentation as measured by reflectometry (R2=0.21, P<0.0001 for the African-American sample and R2=0.16, P<0.0001 for the British African-Caribbean sample). These correlations confirm the validity of the ancestry estimates and also indicate the high level of population structure related to admixture, a level that characterizes these populations and that is detectable by using other tests to identify genetic structure. We have also applied two methods of admixture mapping to test for the effects of three candidate genes (TYR, OCA2, MC1R) on pigmentation. We show that TYR and OCA2 have measurable effects on skin pigmentation differences between the west African and west European parental populations. This work indicates that it is possible to estimate the individual ancestry of a person based on DNA analysis with a reasonable number of well-defined genetic markers. The implications and applications of ancestry estimates in biomedical research are discussed.

Read the entire article here.

Tags: , , , , , , , , , , , , , , , , , , , , , , , ,

Let’s Learn From the Past: Cumberland Posey Jr.

Posted in Articles, Biography, History, Media Archive, United States on 2013-09-04 20:03Z by Steven

Let’s Learn From the Past: Cumberland Posey Jr.

The Pittsburgh Post-Gazette
2013-08-29

Michele Sneddon, History Center Communications Assistant

As a standout player, manager and owner, Cumberland Willis Posey Jr. built the Homestead Grays into one of the most successful franchises in Negro League baseball history.

Born on June 20, 1890, Posey grew up in a wealthy African-American household in Homestead. His father, Cumberland “Cap” Posey Sr., was general manager for the Delta Coal Co., president of Diamond Coal and Coke, and president of the Pittsburgh Courier Publishing Co., which became one of the nation’s most influential African-American newspapers.

At Homestead High School, Posey starred as a power-hitting right fielder on the baseball diamond, a fullback on the football field and a dominant guard on the basketball court. Posey attended Penn State University and then the University of Pittsburgh before landing at the Pittsburgh Catholic College of the Holy Ghost, now Duquesne University. He played basketball there and led his team in scoring for three years as “Charles Cumbert,” a fake name used to gain eligibility as a “white” player. While Posey never graduated from college, he established a reputation as one of the region’s top athletes…

Read the entire article here.

Tags: , , , , , , , ,

A Sad Case of Amalgamation

Posted in Articles, Media Archive, Social Work, United States on 2012-12-21 22:45Z by Steven

A Sad Case of Amalgamation

The Brooklyn Daily Eagle
Volume 19, Number 211
1860-09-05
page 1, column 6
Source: Brooklyn Public Library’s Brooklyn Collection

The reporter of the Philadelphia Press has been around among the colored folks of Philadelphia, and In the course of his peregrination he met with the following case of practical amalgamation:

We were next gratified with something previously new to us—a case of practical amalgamation. We had wrought up our feelings to such abhorrence of the intermarriage of races, that nothing short of the absolute misery of families so produced was expected. The chronicle, however, must be true to the experience, and we are compelled to state that this single case of wedded amalgamation was not so repulsive in its effects as we bad wished it to be.

Being cautioned by the officer to say nothing of our prejudices, we passed through a cleanly-arched alley, and trod by a row of rear brick buildings. Hastily glancing through an open door, we saw a thin, neat-looking white woman industriously sewing. At her feet a negro child was playing and she stooped to kiss it as the door post hid her from view.  A black man was chopping wood in the yard. Three yellow children clustered around him, and at the moment the child which bad been gambolling at the woman’s feet tottered from the house and called him ‘Pappy!’

The man looked angrily at us, but he said nothing.

‘Do your children still help you at the market, Tom?’ said the officer.

‘Yes, sir,’ said the man, chopping away at the stick of wood. As he seemed adverse to making any reply, the officer said:

‘Such children as these I never knew—up at 5 o’clock every morning, and wheeling a heavy go-cart through the streets; they are going someday to be richer than their father.’

‘I hope so,’ said the man.  ‘God knows I am poor enough.’ He continued to chop.

‘Nonsense,’ said the officer. ‘Why, Tom, you take care of your money, never drink. How much better off are vou than your neighbors?’

‘I know that,’ said the man, interestedly, leaning upon his axe, ‘but I want to be rich enough to leave this street. I don’t want these boys to grow up with low people or to live in this unhealthy neighborhood. They are good boys, but I don’t like to tell them so. They make—the three of them—as much wages as I do.’

We understood from our guide that the negro and the woman were legally married; that she had been poor, and his attentions to her in poverty had placed her under obligations which ended in wedlock. As we passed out and peeped stealthily again at the woman, fondling her negro babe, she espied us and looked straightforwardly into our faces. There was no shame upon her cheeks.  She seemed to clasp her child still closer, and as we passed out of view we heard her singing.

‘After all,’ said the officer, ‘these children are better off than those miserable mulattoes who have no recognised fathers. If amalgamation is to become an institution, I prefer it sanctioned by marriage.’

We looked forward to that woman’s career. With the existing feelings of society, thrift and integrity will benefit her little; for the life she has chosen will ever cling to her, and every social advance she may make with her dusky husband will make her more opprobrious and abhorred. It is a hard case.

Tags: , , , ,

Census Bureau Reports Final 2010 Census Data for the United States

Posted in Articles, Census/Demographics, Louisiana, Media Archive, Mississippi, Texas, United States, Virginia on 2011-03-25 02:15Z by Steven

Census Bureau Reports Final 2010 Census Data for the United States

United States Census Bureau
Census 2010
2011-03-24

The U.S. Census Bureau announced today that 2010 Census population totals and demographic characteristics have been released for communities in all 50 states, the District of Columbia and Puerto Rico. These data have provided the first look at population counts for small areas and race, Hispanic origin, voting age and housing unit data released from the 2010 Census. With the release of data for all the states, national-level counts of these characteristics are now available.

For each state, the Census Bureau will provide summaries of population totals, as well as data on race, Hispanic origin and voting age for multiple geographies within the state, such as census blocks, tracts, voting districts, cities, counties and school districts.

According to Public Law 94-171, the Census Bureau must provide redistricting data to the 50 states no later than April 1 of the year following the census. As a result, the Census Bureau is delivering the data state-by-state on a flow basis. All states will receive their data by April 1, 2011.

Highlights by Steven F. Riley

  • The United States population (for apportionment purposes)  is 308,745,538. This represents a 9.71% increase over 2000.
  • The U.S. population including Puerto Rico is 312,471,327.  This represents a 9.55% increase over 2000.
  • The number of repondents (excluding Puerto Rico) checking two or more races (TOMR) is 9,009,073 or 2.92% of the population. This represents a 31.98% increase over 2000.
  • The number of repondents (including Puerto Rico) checking TOMR is 9,026,389 or 2.89% of the population.  This represents a 29.23% increase over 2000.
  • Hawaii has the highest TOMR response rate at 23.57%, followed by Alaska (7.30%), Oklahoma (5.90%) and California (4.87%).
  • California has the highest TOMR population at 1,815,384, followed by Texas (679,001), New York (585,849), and Florida (472,577).
  • Mississppi has the lowest TOMR response rate at 1.15%, followed by West Virginia (1.46%),  Alabama (1.49%) and Maine (1.58%).
  • Vermont has the lowest TOMR population at 10,753, followed by North Dakota (11,853), Wyoming (12,361) and South Dakota (17,283).
  • South Carolina has the highest increase in the TOMR response rate at 100.09%, followed by North Carolina (99.69%), Delaware (83.03%) and Georgia (81.71%).
  • New Jersey has the lowest increase in the TOMR response rate at 12.42%, followed by California (12.92%), New Mexico (16.11%), and Massachusetts (17.81%).
  • Puerto Rico has a 22.83% decrease in the TOMR response rate and New York has a 0.73% decrease in the TOMR response race.  No other states or territories reported decreases.
2010 Census Data for “Two or More Races” for States Above
# State Total Population Two or More Races (TOMR) Percentage Total Pop. % Change from 2000 TOMR % Change from 2000
1. Louisiana 4,533,372 72,883 1.61 1.42 51.01
2. Mississippi 2,967,297 34,107 1.15 4.31 70.36
3. New Jersey 8,791,894 240,303 2.73 4.49 12.42
4. Virginia 8,001,024 233,400 2.92 13.03 63.14
5. Maryland 5,773,552 164,708 2.85 9.01 59.00
6. Arkansas 2,915,918 72,883 2.50 9.07 59.50
7. Iowa 3,046,355 53,333 1.75 4.10 67.83
8. Indiana 6,483,802 127,901 1.97 6.63 69.02
9. Vermont 625,741 10,753 1.71 2.78 46.60
10. Illinois 12,830,632 289,982 2.26 3.31 23.38
11. Oklahoma 3,751,351 221,321 5.90 8.71 41.89
12. South Dakota 814,180 17,283 2.12 7.86 70.18
13. Texas 25,145,561 679,001 2.70 20.59 31.93
14. Washington 6,724,540 312,926 4.65 14.09 46.56
15. Oregon 3,831,074 144,759 3.78 11.97 38.20
16. Colorado 5,029,196 172,456 3.43 16.92 41.14
17. Utah 2,763,885 75,518 2.73 23.77 60.01
18. Nevada 2,700,551 126,075 4.67 35.14 64.96
19. Missouri 5,988,927 124,589 2.08 7.04 51.82
20. Alabama 4,779,736 71,251 1.49 7.48 61.28
21. Hawaii 1,360,301 320,629 23.57 12.28 23.63
22. Nebraska 1,826,341 39,510 2.16 6.72 64.95
23. North Carolina 9,535,483 206,199 2.16 18.46 99.69
24. Delaware 897,934 23,854 2.66 14.59 83.03
25. Kansas 2,853,118 85,933 3.01 6.13 52.10
26. Wyoming 563,626 12,361 2.19 14.14 39.15
27. California 37,253,956 1,815,384 4.87 9.99 12.92
28. Ohio 11,536,504 237,765 2.06 1.59 50.59
29. Connecticut 3,574,097 92,676 2.59 4.95 23.82
30. Pennsylvania 12,702,379 237,835 1.87 3.43 67.23
31. Wisconsin 5,686,986 104,317 1.83 6.03 55.94
32. Arizona 6,392,017 218,300 3.42 24.59 48.98
33. Idaho 1,567,582 38,935 2.48 21.15 52.04
34. New Mexico 2,059,179 77,010 3.74 13.20 16.11
35. Montana 989,415 24,976 2.52 9.67 58.78
36. Tennessee 6,346,105 110,009 1.73 11.54 74.32
37. North Dakota 672,591 11,853 1.76 4.73 60.22
38. Minnesota 5,303,925 125,145 2.36 7.81 51.25
39. Alaska 710,231 51,875 7.30 13.29 51.92
40. Florida 18,801,310 472,577 2.51 17.63 25.58
41. Georgia 9,687,653 207,489 2.14 18.34 81.71
42. Kentucky 4,339,367 75,208 1.73 7.36 77.20
43. New Hampshire 1,316,470 21,382 1.62 6.53 61.81
44. Michigan 9,883,640 230,319 2.33 -0.55 19.70
45. Massachusetts 6,547,629 172,003 2.63 3.13 17.81
46. Rhode Island 1,052,567 34,787 3.30 0.41 23.14
47. South Carolina 4,625,364 79,935 1.73 15.29 100.09
48. West Virginia 1,852,994 27,142 1.46 2.47 71.92
49. New York 19,378,102 585,849 3.02 2.12 -0.73
50. Puerto Rico 3,725,789 122,246 3.28 -2.17 -22.83
51. Maine 1,328,361 20,941 1.58 4.19 65.58
52. District of Columbia 601,723 17,316 2.88 5.19 71.92
Total (with Puerto Rico) 312,471,327 9,026,389 2.89 9.55 29.23
U.S. Population 308,745,538 9,009,073 2.92 9.71 31.98

Tables compiled by Steven F. Riley. Source: United States Census Bureau

2000 Census Data for “Two or More Races” for States Above
# State Total Population Two or More Races (TOMR) Percentage
1. Louisiana 4,469,976 48,265 1.08
2. Mississippi 2,844,658 20,021 0.74
3. New Jersey 8,414,250 213,755 2.54
4. Virginia 7,078,515 143,069 2.02
5. Maryland 5,296,486 103,587 1.96
6. Arkansas 2,673,400 35,744 1.34
7. Iowa 2,926,324 31,778 1.09
8. Indiana 6,080,485 75,672 1.24
9. Vermont 608,827 7,335 1.20
10. Illinois 12,419,293 235,016 1.89
11. Oklahoma 3,450,654 155,985 4.52
12. South Dakota 754,844 10,156 1.35
13. Texas 20,851,820 514,633 2.47
14. Washington 5,894,121 213,519 3.62
15. Oregon 3,421,399 104,745 3.06
16. Colorado 4,301,261 122,187 2.84
17. Utah 2,233,169 47,195 2.11
18. Nevada 1,998,257 76,428 3.82
19. Missouri 5,595,211 82,061 1.47
20. Alabama 4,447,100 44,179 0.99
21. Hawaii 1,211,537 259,343 21.41
22. Nebraska 1,711,263 23,953 1.40
23. North Carolina 8,049,313 103,260 1.28
24. Delaware 783,600 13,033 1.66
25. Kansas 2,688,418 56,496 2.10
26. Wyoming 493,782 8,883 1.80
27. California 33,871,648 1,607,646 4.75
28. Ohio 11,353,140 157,885 1.39
29. Connecticut 3,405,565 74,848 2.20
30. Pennsylvania 12,281,054 142,224 1.16
31. Wisconsin 5,363,675 66,895 1.25
32. Arizona 5,130,632 146,526 2.86
33. Idaho 1,293,953 25,609 1.98
34. New Mexico 1,819,046 66,327 3.65
35. Montana 902,195 15,730 1.74
36. Tennessee 5,689,283 63,109 1.11
37. North Dakota 642,200 7,398 1.15
38. Minnesota 4,919,479 82,742 1.68
39. Alaska 626,932 34,146 5.45
40. Florida 15,982,378 376,315 2.35
41. Georgia 8,186,453 114,188 1.39
42. Kentucky 4,041,769 42,443 1.05
43. New Hampshire 1,235,786 13,214 1.07
44. Michigan 9,938,444 192,416 1.94
45. Massachusetts 6,349,097 146,005 2.30
46. Rhode Island 1,048,319 28,251 2.69
47. South Carolina 4,012,012 39,950 1.00
48. West Virginia 1,808,344 15,788 0.87
49. New York 18,976,457 590,182 3.11
50. Puerto Rico 3,808,610 158,415 4.16
51. Maine 1,274,923 12,647 0.99
52. District of Columbia 572,059 13,446 2.35
Total (with Puerto Rico) 285,230,516 6,984,643 2.45
  United States 281,421,906 6,826,228 2.43

Tables compiled by Steven F. Riley.  Source: United States Census Bureau

Tags: , , , , , , , , , , , , , , , , , , , , , , , , , , , , , , , , , , , , , , , , , , , , , , ,

Cultural Activities, Identities, and Mental Health Among Urban American Indians with Mixed Racial/Ethnic Ancestries

Posted in Articles, Identity Development/Psychology, Media Archive, Native Americans/First Nation, Social Work, United States on 2010-12-30 02:27Z by Steven

Cultural Activities, Identities, and Mental Health Among Urban American Indians with Mixed Racial/Ethnic Ancestries

Race and Social Problems
Volume 2, Number 2 (2010)
pages 101-114
DOI: 10.1007/s12552-010-9028-9

Yoshitaka Iwasaki, Professor of Rehabilitation Sciences and Social Work
Temple University

Namorah Gayle Byrd, Assistant Professor, Developmental English
Gloucester County College, New Jersey

Focus groups were conducted to appreciate the voices of Urban American Indians (UAI) who have mixed ancestries residing in Philadelphia, Pennsylvania. Participants (15 women and 10 men, 19–83 years of age) with a variety of Native ancestries coming from different nations (i.e., blackfeet, blackminkwa, Cherokee, Creek, Delaware, Lakota, Powhatan, Seminole, and Shawnee) reported to also have a Non-Native racial/ethnic ancestry such as African/black, Hispanic, and/or Caucasian/white. Specifically, this study provided evidence about (a) the complexity and challenge of being “mixed” UAI (e.g., “living a culture” as opposed to blood quantum in determining a personal identity) (b) the linkage of cultural identities to mental health (c) contributions of cultural activities to identities and mental health (e.g., therapeutic and healing functions of cultural activities), and (d) very limited urban Native-oriented mental health service (e.g., visions for Native American-centered mental health clinic in an urban setting). Building on those UAI’s voices, this paper provides a context for the need of a culturally respectful transformation of urban mental health system by highlighting the clinical significance of cultural identity and mental health promotion for UAI.

Read or purchase the article here.

Tags: , , , , , ,

Running a Thousand Miles for Freedom or The Escape of William and Ellen Craft from Slavery

Posted in Autobiography, Books, History, Media Archive, Monographs, Passing, Slavery, United States on 2009-11-08 04:41Z by Steven

Running a Thousand Miles for Freedom or The Escape of William and Ellen Craft from Slavery

Louisiana State University Press
Originally Published: 1860
Published by LSU Press: 1999
120 pages
Trim: 6 x 9
Illustrations: 5 halftones
ISBN-13: 978-0-8071-2320-1 Paper

William Craft

With a Foreword and Biographical Essay by

Richard J. M. Blackett,  Andrew Jackson Professor of History
Vanderbilt University

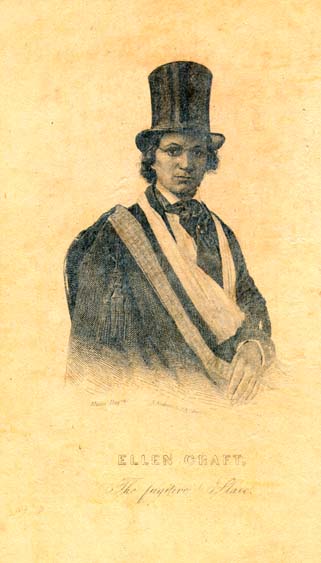
Husband and wife William and Ellen Craft’s [her mother was a slave and her father was her mother’s owner.] break from slavery in 1848 was perhaps the most extraordinary in American history. Numerous newspaper reports in the United States and abroad told of how the two—fair-skinned Ellen disguised as a white slave master and William posing as her servant—negotiated heart-pounding brushes with discovery while fleeing Macon, Georgia, for Philadelphia and eventually Boston. No account, though, conveyed the ingenuity, daring, good fortune, and love that characterized their flight for freedom better than the couple’s own version, published in 1860, a remarkable authorial accomplishment only twelve years beyond illiteracy. Now their stirring first-person narrative and Richard Blackett’s excellent interpretive pieces are brought together in one volume to tell the complete story of the Crafts.


Ellen Craft

Summary by Monique Pierce of Documenting The South:

Published in 1860, shortly before the start of the Civil War, Running a Thousand Miles for Freedom is the narrative of William and Ellen Craft‘s escape from slavery. Both were born and grew up in Georgia, and they lived in Macon prior to their escape. In December 1848 they devised a plan in which Ellen Craft, who was very light- skinned, would dress as a man and pretend to be a rheumatic seeking better treatment in Philadelphia. William was to accompany her and act as her slave. Relying exclusively on means of public transportation, including trains and steamers, they made their way to Savannah, then to Charleston, Wilmington, North Carolina, Washington, D.C., Baltimore, and Philadelphia, where they arrived on Christmas Day. They then relocated to Boston and sailed for England after the Fugitive Slave Law enabled slave hunters to pursue them even in free states. At the time this work was published, they were living in England with their sons. The narrative includes many anecdotes about slavery and freedom for Blacks and discusses how they were treated in both the South and the North.

Read the entire book in HTML format here.  You may also obtain it here.

Tags: , , , , , , , ,