Defending Home and Hearth: Walter White Recalls the 1906 Atlanta Race Riot

Posted in Articles, Autobiography, Media Archive, United States on 2011-10-12 22:21Z by Steven

Defending Home and Hearth: Walter White Recalls the 1906 Atlanta Race Riot

Web Source: History Matters: The U.S. Survey Course on the Web
Walter White, A Man Called White
1948; reprint, New York: Arno Press, 1969
pages 5–12

Walter White (1893-1955)

The riots that broke out between 1898 and 1906 were part of a pattern of anti-black violence that included several hundred lynchings each year. One of the most savage race riots in these years erupted in Atlanta on September 22, 1906 after vague reports of African Americans harassing white women. Over five days at least ten black people were killed while Atlanta’s police did nothing to protect black citizens, going so far as to confiscate guns from black Atlantans while allowing whites to remain armed. In this selection from his memoirs, Walter White, the future head of the NAACP recalled how, at age 13, he and his father defended their home from white rioters.

The unseasonably oppressive heat of an Indian summer day hung like a steaming blanket over Atlanta. My sisters and I had casually commented upon the unusual quietness. It seemed to stay Mother’s volubility and reduced Father, who was more taciturn, to monosyllables. But, as I remember it, no other sense of impending trouble impinged upon our consciousness.

I had read the inflammatory headlines in the Atlanta News and the more restrained ones in the Atlanta Constitution which reported alleged rapes and other crimes committed by Negroes. But these were so standard and familiar that they made—as I look back on it now—little impression. The stories were more frequent, however, and consisted of eight-column streamers instead of the usual two or four-column ones.

Father was a mail collector. His tour of duty was from three to eleven P.M. He made his rounds in a little cart into which one climbed from a step in the rear. I used to drive the cart for him from two until seven, leaving him at the point nearest our home on Houston Street, to return home either for study or sleep. That day Father decided that I should not go with him. I appealed to Mother, who thought it might be all right, provided Father sent me home before dark because, she said, “I don’t think they would dare start anything before nightfall.”Father told me as we made the rounds that ominous rumors of a race riot that night were sweeping the town. But I was too young that morning to understand the background of the riot. I became much older during the next thirty-six hours, under circumstances which I now recognize as the inevitable outcome of what had preceded.

…Late in the afternoon friends of my father’s came to warn of more trouble that night. They told us that plans had been perfected for a mob to form on Peachtree Street just after nightfall to march down Houston Street to what the white people called “Darktown,” three blocks or so below our house, to “clean out the niggers.” There had never been a firearm in our house before that day. Father was reluctant even in those circumstances to violate the law, but he at last gave in at Mother’s insistence…

Read the entire text here.

Tags: , , , ,

More metro Atlantans say they’re multiracial: Fast-growing segment represents a cultural shift that’s nationwide

Posted in Articles, Census/Demographics, Media Archive, United States on 2011-09-09 01:07Z by Steven

More metro Atlantans say they’re multiracial: Fast-growing segment represents a cultural shift that’s nationwide

Atlanta Journal-Constitution
2011-09-03

Bo Emerson

When Evelyn Brown-Wilder was growing up in Tuscaloosa, Ala., in the 1950s, life was a matter of warring opposites. Though some of her ancestors were white and her face was pale, the law said she was black. She wrapped both arms around that identity.

Her daughter, Sonya Colvin-Boyd, lives in a different world and chooses a different identity. When it came time for Colvin-Boyd to indicate her race on her 2000 U.S. census form, she picked both white and black. “We’re all mixed,” said the Powder Springs resident.
 
Claiming both races puts her in one of the fastest-growing segments of America’s population. It’s a trend that reveals seismic shifts in both outward social and cultural relations and inward notions of individual identity.
 
Across metro Atlanta’s counties, the last decade saw a doubling or tripling of the number of people identifying themselves as being of more than one race, according to the Census Bureau. In Gwinnett County, the number of respondents checking two or more races rose from 12,673 in 2000 to 25,292 in 2010, a 99 percent jump. In Fulton County, the number rose from 11,853 to 20,279, a 71 percent increase. In Henry County, the numbers went up 269 percent…

…Yet mixed ancestry is a matter of fact for most Americans whose ancestors include people from Africa; they operate in a world of gradations where skin color sometimes determines status. “A lot of darker-complected blacks saw it as the ‘house Negro’ syndrome versus the ‘field Negro’ syndrome,” said Troy Gordon, 42, who teaches elementary school in Lithonia. Gordon is a copper-skinned mix of African-American and American Indian, and his light skin drew “flak” when he was younger.
 
He knew, growing up, that “black” was a whole range of colors, from his white great-grandmother, to his “paper-sack brown” aunt and his green-eyed, red-haired uncle. “I was black,” said Gordon, “but you’d see family pictures and say, ‘Wow, who’s this white lady?’”
 
Such conversations were limited back then. Today, there are many more talks about their multiracial heritage with his light-skinned 4-year-old son Chase. Chase’s mother is white, and he considers himself white, though he pronounces it “wipe.”…

Read the entire article here.

Tags: , , ,

A Health Survey of the Seminole Indians

Posted in Anthropology, Health/Medicine/Genetics, Media Archive, Native Americans/First Nation, United States on 2011-06-24 04:02Z by Steven

A Health Survey of the Seminole Indians

Yale Journal Biology and Medicine
Volume 6, Number 2 (December 1933)
pages 155–177

H. Hamlin

Among the numerous tribes of Indians living in Oklahoma the Seminoles offer some interesting phenomena for study which may contribute information on the subject of race mixture and its relationship to environment and health. The early history of the tribe in its original habitat of the Florida Everglades is not without romantic color, embodying as it does the Spanish occupation of the Southeastern United States and the stormy times before and after the War of 1812 that culminated in the Florida purchase. Many other tribes besides the Seminoles were occupying rich lands that European settlers coveted for plantations so that agitation for removal of the Indians by coercion gained increasing favor. Slavery augmented the conflict since negro deserters were continually seeking refuge among the Indians, especially in parts that now constitute Georgia and Florida.

It is recorded that as early as 1785 bands of Cherokees, Choctaws, Delawares and Shawnees began migrating west to settle because of pressure from whites along the borders of their old domain and the scarcity of game. The transfer of Indians comprising the Cherokee, Choctaw, Chickasaw, Creek and Seminole tribes from their indigenous habitat to lands in what is now the state of Oklahoma was carried on with continuous difficulty until after 1840. The government was forced to conduct two expensive military campaigns against the Seminoles, and over a thousand recalcitrants refused to be caught and expatriated. These survivors remained in Florida. By 1906 around 100,000 individuals, of whom only about 26.4 per cent were full-bloods, had been officially enrolled as the Five Civilized Tribes and had been given individual land grants.

From the foregoing historical outline the possibilities of comparative study on the present-day Seminoles in both Oklahoma and Florida can be understood. Such a project was sponsored by the Laboratory of Anthropology at Santa Fe, New Mexico, during the summer of 1932 and placed under the direction of Dr. W. M. Krogman of the Anatomy Department of Western Reserve University. The greater part of the work resolved itself into the compilation of detailed anthropometric measurements of selected individuals. The tribal rolls, upon which the government based the land allotments, made feasible the deduction of rather accurate genealogical tables for four or five generations. The statements of every subject concerning his or her family were checked and protracted further by comparison with Campbell’s Abstract of Seminole Indian Census Cards, which proved an invaluable source of information. It is hoped that opportunity may avail to correlate the findings on physical measurements and other criteria of the Oklahoma Seminoles with the results of a similar procedure among the Seminoles still living in Florida, the latter serving as a control group…

…After the Creek war of 1813-14 a great many Creeks from the upper Creek country moved into Florida. They increased the population considerably and began mixing with the predominant Hitchiti (Oconee) racial element. This new strain was definitely Creek and later came to be identified with the Seminole. Such an interpretation is substantiated further by Wissler’, who classifies the languages of the Upper Creeks, Lower Creeks, and Seminoles together under the northern division of Muskogee proper. It seems clear that the Florida Seminoles were originally derived from the non-Muskogean Hitchiti of Georgia admixed with the earlier Floridian Yamasee and Yuchi, and this combination later admixed with Muskogee, mostly Creek. Before his departure for the west therefore, the Florida Seminole undoubtedly had a high percentage of Creek blood; and the two by impact of association had become linked enough in language and culture to obscure their separate origin.

Before the advent of Seminole stock in the west there was unquestionably an appreciable amount of negro blood present. This was a result of slavery, which reached its greatest development as a social practice in the Southeast during the latter part of the eighteenth and the first half of the nineteenth centuries. Large numbers of slaves apparently succeeded in escaping from their masters to gain sanctuary among the Florida Indians. It would seem that negroes were usually anxious to make their way into Florida where they were often able to acquire a kind of group independence among the Indians. A large number of negroes accompanied the Five Tribes on their westward migration, including slaves of the Indians as well as those who had intermarried and their offspring. To the Creek fraction represented in Florida Seminole blood, therefore, must be added an unknown but quite definite component representing negro admixture acquired prior to removal. There probably had been some infusion of white blood with the Seminoles through Spanish intermixture before they took up residence in the west. Nash”, Giddings and Bartram’ predicate its occurrence in their writings, but the emphasis on the negro element is much greater. According to Nash”, the amount of white blood in the modern Florida Seminoles has increased to some extent, and this view is confirmed by others, notably Hrdlikcka. On the other hand negro intermixture among the present-day descendants of the original Florida Seminoles has declined. The population has been reported to be around 500 for a number of decades so that investigators have been able to tabulate race crossing with some certainty’0. White half-castes are granted full status by the Indians and an increase in their number is predicted for the future. Presumably, the propagation of white blood in the Florida Indians since the Seminole wars may be attributed to the offspring of unsanctioned Indian-White matings…


Pure Seminole—Age 44.


Seminole-Negro—Age 25.


Seminole-White—Age 34.

Read the entire article here.

Tags: , , , ,

Census Bureau Reports Final 2010 Census Data for the United States

Posted in Articles, Census/Demographics, Louisiana, Media Archive, Mississippi, Texas, United States, Virginia on 2011-03-25 02:15Z by Steven

Census Bureau Reports Final 2010 Census Data for the United States

United States Census Bureau
Census 2010
2011-03-24

The U.S. Census Bureau announced today that 2010 Census population totals and demographic characteristics have been released for communities in all 50 states, the District of Columbia and Puerto Rico. These data have provided the first look at population counts for small areas and race, Hispanic origin, voting age and housing unit data released from the 2010 Census. With the release of data for all the states, national-level counts of these characteristics are now available.

For each state, the Census Bureau will provide summaries of population totals, as well as data on race, Hispanic origin and voting age for multiple geographies within the state, such as census blocks, tracts, voting districts, cities, counties and school districts.

According to Public Law 94-171, the Census Bureau must provide redistricting data to the 50 states no later than April 1 of the year following the census. As a result, the Census Bureau is delivering the data state-by-state on a flow basis. All states will receive their data by April 1, 2011.

Highlights by Steven F. Riley

  • The United States population (for apportionment purposes)  is 308,745,538. This represents a 9.71% increase over 2000.
  • The U.S. population including Puerto Rico is 312,471,327.  This represents a 9.55% increase over 2000.
  • The number of repondents (excluding Puerto Rico) checking two or more races (TOMR) is 9,009,073 or 2.92% of the population. This represents a 31.98% increase over 2000.
  • The number of repondents (including Puerto Rico) checking TOMR is 9,026,389 or 2.89% of the population.  This represents a 29.23% increase over 2000.
  • Hawaii has the highest TOMR response rate at 23.57%, followed by Alaska (7.30%), Oklahoma (5.90%) and California (4.87%).
  • California has the highest TOMR population at 1,815,384, followed by Texas (679,001), New York (585,849), and Florida (472,577).
  • Mississppi has the lowest TOMR response rate at 1.15%, followed by West Virginia (1.46%),  Alabama (1.49%) and Maine (1.58%).
  • Vermont has the lowest TOMR population at 10,753, followed by North Dakota (11,853), Wyoming (12,361) and South Dakota (17,283).
  • South Carolina has the highest increase in the TOMR response rate at 100.09%, followed by North Carolina (99.69%), Delaware (83.03%) and Georgia (81.71%).
  • New Jersey has the lowest increase in the TOMR response rate at 12.42%, followed by California (12.92%), New Mexico (16.11%), and Massachusetts (17.81%).
  • Puerto Rico has a 22.83% decrease in the TOMR response rate and New York has a 0.73% decrease in the TOMR response race.  No other states or territories reported decreases.
2010 Census Data for “Two or More Races” for States Above
# State Total Population Two or More Races (TOMR) Percentage Total Pop. % Change from 2000 TOMR % Change from 2000
1. Louisiana 4,533,372 72,883 1.61 1.42 51.01
2. Mississippi 2,967,297 34,107 1.15 4.31 70.36
3. New Jersey 8,791,894 240,303 2.73 4.49 12.42
4. Virginia 8,001,024 233,400 2.92 13.03 63.14
5. Maryland 5,773,552 164,708 2.85 9.01 59.00
6. Arkansas 2,915,918 72,883 2.50 9.07 59.50
7. Iowa 3,046,355 53,333 1.75 4.10 67.83
8. Indiana 6,483,802 127,901 1.97 6.63 69.02
9. Vermont 625,741 10,753 1.71 2.78 46.60
10. Illinois 12,830,632 289,982 2.26 3.31 23.38
11. Oklahoma 3,751,351 221,321 5.90 8.71 41.89
12. South Dakota 814,180 17,283 2.12 7.86 70.18
13. Texas 25,145,561 679,001 2.70 20.59 31.93
14. Washington 6,724,540 312,926 4.65 14.09 46.56
15. Oregon 3,831,074 144,759 3.78 11.97 38.20
16. Colorado 5,029,196 172,456 3.43 16.92 41.14
17. Utah 2,763,885 75,518 2.73 23.77 60.01
18. Nevada 2,700,551 126,075 4.67 35.14 64.96
19. Missouri 5,988,927 124,589 2.08 7.04 51.82
20. Alabama 4,779,736 71,251 1.49 7.48 61.28
21. Hawaii 1,360,301 320,629 23.57 12.28 23.63
22. Nebraska 1,826,341 39,510 2.16 6.72 64.95
23. North Carolina 9,535,483 206,199 2.16 18.46 99.69
24. Delaware 897,934 23,854 2.66 14.59 83.03
25. Kansas 2,853,118 85,933 3.01 6.13 52.10
26. Wyoming 563,626 12,361 2.19 14.14 39.15
27. California 37,253,956 1,815,384 4.87 9.99 12.92
28. Ohio 11,536,504 237,765 2.06 1.59 50.59
29. Connecticut 3,574,097 92,676 2.59 4.95 23.82
30. Pennsylvania 12,702,379 237,835 1.87 3.43 67.23
31. Wisconsin 5,686,986 104,317 1.83 6.03 55.94
32. Arizona 6,392,017 218,300 3.42 24.59 48.98
33. Idaho 1,567,582 38,935 2.48 21.15 52.04
34. New Mexico 2,059,179 77,010 3.74 13.20 16.11
35. Montana 989,415 24,976 2.52 9.67 58.78
36. Tennessee 6,346,105 110,009 1.73 11.54 74.32
37. North Dakota 672,591 11,853 1.76 4.73 60.22
38. Minnesota 5,303,925 125,145 2.36 7.81 51.25
39. Alaska 710,231 51,875 7.30 13.29 51.92
40. Florida 18,801,310 472,577 2.51 17.63 25.58
41. Georgia 9,687,653 207,489 2.14 18.34 81.71
42. Kentucky 4,339,367 75,208 1.73 7.36 77.20
43. New Hampshire 1,316,470 21,382 1.62 6.53 61.81
44. Michigan 9,883,640 230,319 2.33 -0.55 19.70
45. Massachusetts 6,547,629 172,003 2.63 3.13 17.81
46. Rhode Island 1,052,567 34,787 3.30 0.41 23.14
47. South Carolina 4,625,364 79,935 1.73 15.29 100.09
48. West Virginia 1,852,994 27,142 1.46 2.47 71.92
49. New York 19,378,102 585,849 3.02 2.12 -0.73
50. Puerto Rico 3,725,789 122,246 3.28 -2.17 -22.83
51. Maine 1,328,361 20,941 1.58 4.19 65.58
52. District of Columbia 601,723 17,316 2.88 5.19 71.92
Total (with Puerto Rico) 312,471,327 9,026,389 2.89 9.55 29.23
U.S. Population 308,745,538 9,009,073 2.92 9.71 31.98

Tables compiled by Steven F. Riley. Source: United States Census Bureau

2000 Census Data for “Two or More Races” for States Above
# State Total Population Two or More Races (TOMR) Percentage
1. Louisiana 4,469,976 48,265 1.08
2. Mississippi 2,844,658 20,021 0.74
3. New Jersey 8,414,250 213,755 2.54
4. Virginia 7,078,515 143,069 2.02
5. Maryland 5,296,486 103,587 1.96
6. Arkansas 2,673,400 35,744 1.34
7. Iowa 2,926,324 31,778 1.09
8. Indiana 6,080,485 75,672 1.24
9. Vermont 608,827 7,335 1.20
10. Illinois 12,419,293 235,016 1.89
11. Oklahoma 3,450,654 155,985 4.52
12. South Dakota 754,844 10,156 1.35
13. Texas 20,851,820 514,633 2.47
14. Washington 5,894,121 213,519 3.62
15. Oregon 3,421,399 104,745 3.06
16. Colorado 4,301,261 122,187 2.84
17. Utah 2,233,169 47,195 2.11
18. Nevada 1,998,257 76,428 3.82
19. Missouri 5,595,211 82,061 1.47
20. Alabama 4,447,100 44,179 0.99
21. Hawaii 1,211,537 259,343 21.41
22. Nebraska 1,711,263 23,953 1.40
23. North Carolina 8,049,313 103,260 1.28
24. Delaware 783,600 13,033 1.66
25. Kansas 2,688,418 56,496 2.10
26. Wyoming 493,782 8,883 1.80
27. California 33,871,648 1,607,646 4.75
28. Ohio 11,353,140 157,885 1.39
29. Connecticut 3,405,565 74,848 2.20
30. Pennsylvania 12,281,054 142,224 1.16
31. Wisconsin 5,363,675 66,895 1.25
32. Arizona 5,130,632 146,526 2.86
33. Idaho 1,293,953 25,609 1.98
34. New Mexico 1,819,046 66,327 3.65
35. Montana 902,195 15,730 1.74
36. Tennessee 5,689,283 63,109 1.11
37. North Dakota 642,200 7,398 1.15
38. Minnesota 4,919,479 82,742 1.68
39. Alaska 626,932 34,146 5.45
40. Florida 15,982,378 376,315 2.35
41. Georgia 8,186,453 114,188 1.39
42. Kentucky 4,041,769 42,443 1.05
43. New Hampshire 1,235,786 13,214 1.07
44. Michigan 9,938,444 192,416 1.94
45. Massachusetts 6,349,097 146,005 2.30
46. Rhode Island 1,048,319 28,251 2.69
47. South Carolina 4,012,012 39,950 1.00
48. West Virginia 1,808,344 15,788 0.87
49. New York 18,976,457 590,182 3.11
50. Puerto Rico 3,808,610 158,415 4.16
51. Maine 1,274,923 12,647 0.99
52. District of Columbia 572,059 13,446 2.35
Total (with Puerto Rico) 285,230,516 6,984,643 2.45
  United States 281,421,906 6,826,228 2.43

Tables compiled by Steven F. Riley.  Source: United States Census Bureau

Tags: , , , , , , , , , , , , , , , , , , , , , , , , , , , , , , , , , , , , , , , , , , , , , , ,

Robert Stafford of Cumberland Island: Growth of a Planter

Posted in Books, History, Media Archive, Monographs, Slavery, United States on 2010-08-13 16:54Z by Steven

Robert Stafford of Cumberland Island: Growth of a Planter

University of Georgia Press
1995
376 pages
Illustrated
Trim size: 6 x 9
Paperback ISBN: 978-0-8203-1738-0

Mary R. Bullard

Society, politics, agriculture, and mixed-race unions in a coastal Georgia planter community

Robert Stafford of Cumberland Island offers a rare glimpse into the life and times of a nineteenth-century planter on one of Georgia’s Sea Islands. Born poor, Robert Stafford (1790-1877) became the leading planter on his native Cumberland Island. Specializing in the highly valued long staple variety of cotton, he claimed among his assets more than 8,000 acres and 350 slaves.

Mary R. Bullard recounts Stafford’s life in the context of how events from the Federalist period to the Civil War to Reconstruction affected Sea Island planters. As she discusses Stafford’s associations with other planters, his business dealings (which included banking and railroad investments), and the day-to-day operation of his plantation, Bullard also imparts a wealth of information about cotton farming methods, plantation life and material culture, and the geography and natural history of Cumberland Island.

Stafford’s career was fairly typical for his time and place; his personal life was not. He never married, but fathered six children by Elizabeth Bernardey, a mulatto slave nurse. Bullard’s discussion of Stafford’s decision to move his family to Groton, Connecticut—and freedom—before the Civil War illuminates the complex interplay between southern notions of personal honor, the staunch independent-mindedness of Sea Island planters, and the practice and theory of racial separation.

In her afterword to the Brown Thrasher edition, Bullard presents recently uncovered information about a second extralegal family of Robert Stafford as well as additional information about Elizabeth Bernardey’s children and the trust funds Stafford provided for them.

Tags: , , , , ,

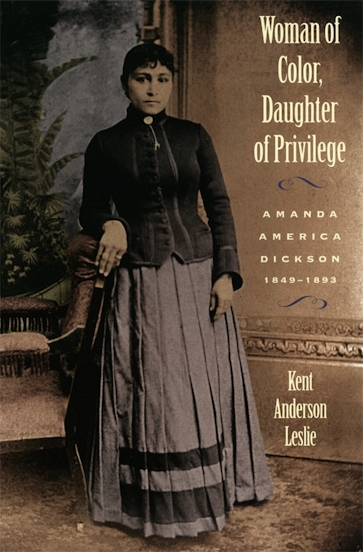
Woman of Color, Daughter of Privilege: Amanda America Dickson, 1849–1893

Posted in Biography, Books, History, Law, Media Archive, Monographs, Slavery, United States, Women on 2010-06-25 21:46Z by Steven

Woman of Color, Daughter of Privilege: Amanda America Dickson, 1849–1893

University of Georgia Press
1996
248 pages
Illustrated
Trim size: 6 x 9
Paperback ISBN: 978-0-8203-1871-4

Kent Anderson Leslie

Woman of Color, Daughter of Privilege

The true story of a slave who became the wealthiest black woman in the South

This fascinating story of Amanda America Dickson, born the privileged daughter of a white planter and an unconsenting slave in antebellum Georgia, shows how strong-willed individuals defied racial strictures for the sake of family. Kent Anderson Leslie uses the events of Dickson’s life to explore the forces driving southern race and gender relations from the days of King Cotton through the Civil War, Reconstruction, and New South eras.

Although legally a slave herself well into her adolescence, Dickson was much favored by her father and lived comfortably in his house, receiving a genteel upbringing and education. After her father died in 1885 Dickson inherited most of his half-million dollar estate, sparking off two years of legal battles with white relatives. When the Georgia Supreme Court upheld the will, Dickson became the largest landowner in Hancock County, Georgia, and the wealthiest black woman in the post-Civil War South.

Kent Anderson Leslie’s portrayal of Dickson is enhanced by a wealth of details about plantation life; the elaborate codes of behavior for men and women, blacks and whites in the South; and the equally complicated circumstances under which racial transgressions were sometimes ignored, tolerated, or even accepted.

Table of Contents

  • Acknowledgments
  • Introduction
  • CHAPTER 1. Exceptions to the Rules
  • CHAPTER 2. A Story
  • CHAPTER 3. The Dickson Will
  • CHAPTER 4. The Death of a Lady
  • Appendixes
  • Notes
  • Bibliography
  • Index
Tags: , , ,

Ambiguous Lives: Free Women of Color in Rural Georgia, 1789-1879

Posted in Biography, Books, History, Media Archive, Monographs, Social Science, United States, Women on 2010-02-25 15:36Z by Steven

Ambiguous Lives: Free Women of Color in Rural Georgia, 1789-1879

University of Arkansas Press
1992
304 pages
ISBN Cloth: 1-55728-214-5
ISBN Paper: 1-55728-215-3
Out of Print

Adele Logan Alexander, Professor of History
George Washington University, Washington, D.C.

1992 Winner, Gustavus Myers award as one of the year’s outstanding books promoting racial understanding.

Historians have produced scores of studies on white men, extraordinary white women, and even the often anonymous mass of enslaved Black people in the United States. But in this innovative work, Adele Logan Alexander chronicles there heretofore undocumented dilemmas of one of nineteenth-century America’s most marginalized groups—free women of color in the rural South.

Ambiguous Lives focuses on the women of Alexander’s own family as representative of this subcaste of the African-American community. Their forbears, in fact, included Africans, Native Americans, and whites. Neither black nor white, affluent nor impoverished, enslaved nor truly free, these women of color lived and died in a shadowy realm situated somewhere between the legal, social, and economic extremes of empowered whites and subjugated blacks. Yet, as Alexander persuasively argues, these lives are worthy of attention precisely because of these ambiguities—because the intricacies, gradations, and subtleties of their anomalous experience became part of the tangled skein of American history and exemplify our country’s endless diversity, complexity, and self-contradictions.

Written as a “reclamation” of a long-ignored substratum of our society, Ambiguous Lives is more than the story of one family—it is a well-researched and fascinating profile of America, its race and gender relations, and its complex cultural weave.

Tags: , , ,