From Slavery to Wealth: The Life of Scott Bond

Posted in Biography, Books, Media Archive, Monographs, Slavery, United States on 2013-01-01 01:56Z by Steven

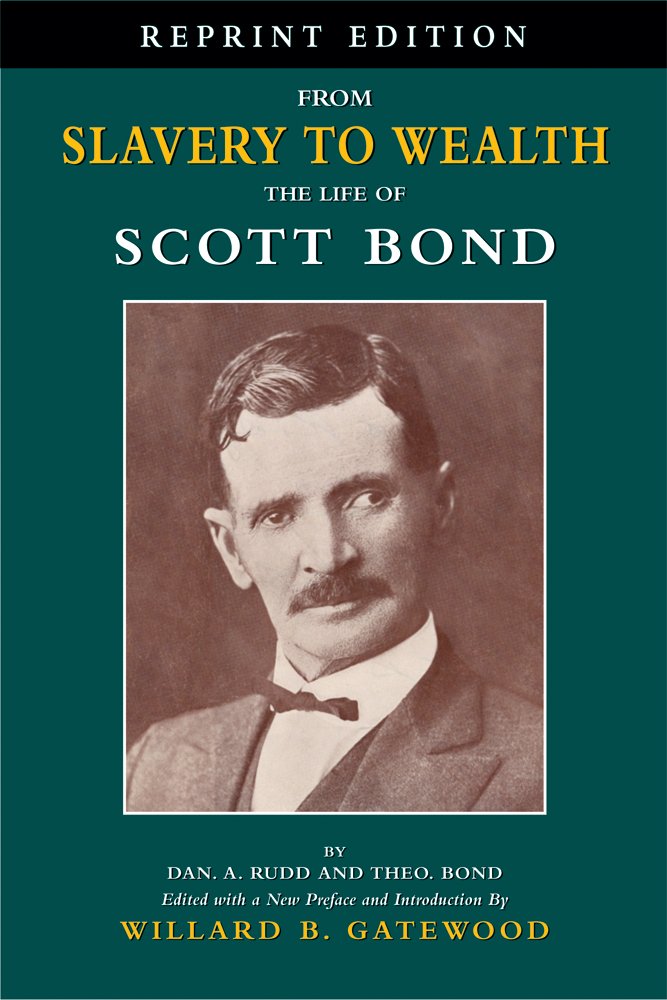
From Slavery to Wealth: The Life of Scott Bond

University of Arkansas Press
February 2008 (Originally Published: 1917)
336 pages
6 x 9; 72 photographs and index
ISBN 13: 978-0-9768007-6-7 ISBN 10: 0-9768007-6-4

Dan. A. (Daniel Arthur) Rudd (1854-1933)

Theo. (Theophilus) Bond

Edited with a new Preface and Introduction by

Willard B. Gatewood, Alumni Distinguished Professor of History Emeritus
University of Arkansas, Fayetteville

In an era in which African Americans were oppressed and deprived of many of the rights and privileges of citizenship, Scott Bond rose from being born a slave in Madison County, Mississippi, in the early 1850s to wealth and status as a farmer, merchant, and business entrepreneur in Madison, Arkansas, by the early 1900s. From Slavery to Wealth is the story of an extraordinary individual widely known and respected at the time of its first publication in 1917, for his integrity, prodigious energy, and strong work ethic. Throughout his career he never wearied of imploring African Americans to seize the opportunities offered them in the South in general and in the Arkansas Delta in particular. Scott Bond enjoyed an enviable reputation among blacks as well as whites. This reputation ultimately extended far beyond his local community to prominent blacks throughout the South and elsewhere, especially after he gained wider exposure as a conspicuous figure in the National Negro Business League in the early years of the twentieth century.

With this 2008 reprint edition, the current generation can be inspired by the man who has been referred to as the black John D. Rockefeller of Arkansas.

Read the entire book (From Slavery to Wealth. The Life of Scott Bond. The Rewards of Honesty, Industry, Economy and Perseverance) via “Documenting the American South” here.

Scott Bond was born in the early 1850s to an enslaved mother named Ann who worked in the Maben-Bond household near Canton, Mississippi. His father was the nephew of a white slave-owner to whom Bond’s mother had temporarily been hired out as a domestic servant. Just prior to the outbreak of the Civil War, Bond and his mother were moved to Arkansas, along with his step-father, William Bond, and the rest of the Maben-Bond family’s slaves. After Emancipation, Bond lived with his step-father until age twenty-two, when he “undertook to vouch for himself” and began work on his lifelong goal of becoming a successful businessman (p. 37). Bond accomplished this goal. At the time of his death he owned and farmed 12,000 acres, while also raising livestock and operating a large mercantile store, at least five cotton gins, a gravel pit, a lumber yard, and a saw mill. A member of the National Negro Business League, Bond supported the efforts of Booker T. Washington, whose philosophies regarding the social advancement of African Americans through economic and agricultural success mirrored Bond’s own. In 1877, he married Magnolia Nash, with whom he had eleven sons. Bond was killed in March 1933 by one of his registered bulls. According to his son, Ulysses, he “went down swinging and died among the things he loved” (p. 152)…

Read the entire summary here.
Tags: , , , , , , , ,

Census Bureau Reports Final 2010 Census Data for the United States

Posted in Articles, Census/Demographics, Louisiana, Media Archive, Mississippi, Texas, United States, Virginia on 2011-03-25 02:15Z by Steven

Census Bureau Reports Final 2010 Census Data for the United States

United States Census Bureau
Census 2010
2011-03-24

The U.S. Census Bureau announced today that 2010 Census population totals and demographic characteristics have been released for communities in all 50 states, the District of Columbia and Puerto Rico. These data have provided the first look at population counts for small areas and race, Hispanic origin, voting age and housing unit data released from the 2010 Census. With the release of data for all the states, national-level counts of these characteristics are now available.

For each state, the Census Bureau will provide summaries of population totals, as well as data on race, Hispanic origin and voting age for multiple geographies within the state, such as census blocks, tracts, voting districts, cities, counties and school districts.

According to Public Law 94-171, the Census Bureau must provide redistricting data to the 50 states no later than April 1 of the year following the census. As a result, the Census Bureau is delivering the data state-by-state on a flow basis. All states will receive their data by April 1, 2011.

Highlights by Steven F. Riley

  • The United States population (for apportionment purposes)  is 308,745,538. This represents a 9.71% increase over 2000.
  • The U.S. population including Puerto Rico is 312,471,327.  This represents a 9.55% increase over 2000.
  • The number of repondents (excluding Puerto Rico) checking two or more races (TOMR) is 9,009,073 or 2.92% of the population. This represents a 31.98% increase over 2000.
  • The number of repondents (including Puerto Rico) checking TOMR is 9,026,389 or 2.89% of the population.  This represents a 29.23% increase over 2000.
  • Hawaii has the highest TOMR response rate at 23.57%, followed by Alaska (7.30%), Oklahoma (5.90%) and California (4.87%).
  • California has the highest TOMR population at 1,815,384, followed by Texas (679,001), New York (585,849), and Florida (472,577).
  • Mississppi has the lowest TOMR response rate at 1.15%, followed by West Virginia (1.46%),  Alabama (1.49%) and Maine (1.58%).
  • Vermont has the lowest TOMR population at 10,753, followed by North Dakota (11,853), Wyoming (12,361) and South Dakota (17,283).
  • South Carolina has the highest increase in the TOMR response rate at 100.09%, followed by North Carolina (99.69%), Delaware (83.03%) and Georgia (81.71%).
  • New Jersey has the lowest increase in the TOMR response rate at 12.42%, followed by California (12.92%), New Mexico (16.11%), and Massachusetts (17.81%).
  • Puerto Rico has a 22.83% decrease in the TOMR response rate and New York has a 0.73% decrease in the TOMR response race.  No other states or territories reported decreases.
2010 Census Data for “Two or More Races” for States Above
# State Total Population Two or More Races (TOMR) Percentage Total Pop. % Change from 2000 TOMR % Change from 2000
1. Louisiana 4,533,372 72,883 1.61 1.42 51.01
2. Mississippi 2,967,297 34,107 1.15 4.31 70.36
3. New Jersey 8,791,894 240,303 2.73 4.49 12.42
4. Virginia 8,001,024 233,400 2.92 13.03 63.14
5. Maryland 5,773,552 164,708 2.85 9.01 59.00
6. Arkansas 2,915,918 72,883 2.50 9.07 59.50
7. Iowa 3,046,355 53,333 1.75 4.10 67.83
8. Indiana 6,483,802 127,901 1.97 6.63 69.02
9. Vermont 625,741 10,753 1.71 2.78 46.60
10. Illinois 12,830,632 289,982 2.26 3.31 23.38
11. Oklahoma 3,751,351 221,321 5.90 8.71 41.89
12. South Dakota 814,180 17,283 2.12 7.86 70.18
13. Texas 25,145,561 679,001 2.70 20.59 31.93
14. Washington 6,724,540 312,926 4.65 14.09 46.56
15. Oregon 3,831,074 144,759 3.78 11.97 38.20
16. Colorado 5,029,196 172,456 3.43 16.92 41.14
17. Utah 2,763,885 75,518 2.73 23.77 60.01
18. Nevada 2,700,551 126,075 4.67 35.14 64.96
19. Missouri 5,988,927 124,589 2.08 7.04 51.82
20. Alabama 4,779,736 71,251 1.49 7.48 61.28
21. Hawaii 1,360,301 320,629 23.57 12.28 23.63
22. Nebraska 1,826,341 39,510 2.16 6.72 64.95
23. North Carolina 9,535,483 206,199 2.16 18.46 99.69
24. Delaware 897,934 23,854 2.66 14.59 83.03
25. Kansas 2,853,118 85,933 3.01 6.13 52.10
26. Wyoming 563,626 12,361 2.19 14.14 39.15
27. California 37,253,956 1,815,384 4.87 9.99 12.92
28. Ohio 11,536,504 237,765 2.06 1.59 50.59
29. Connecticut 3,574,097 92,676 2.59 4.95 23.82
30. Pennsylvania 12,702,379 237,835 1.87 3.43 67.23
31. Wisconsin 5,686,986 104,317 1.83 6.03 55.94
32. Arizona 6,392,017 218,300 3.42 24.59 48.98
33. Idaho 1,567,582 38,935 2.48 21.15 52.04
34. New Mexico 2,059,179 77,010 3.74 13.20 16.11
35. Montana 989,415 24,976 2.52 9.67 58.78
36. Tennessee 6,346,105 110,009 1.73 11.54 74.32
37. North Dakota 672,591 11,853 1.76 4.73 60.22
38. Minnesota 5,303,925 125,145 2.36 7.81 51.25
39. Alaska 710,231 51,875 7.30 13.29 51.92
40. Florida 18,801,310 472,577 2.51 17.63 25.58
41. Georgia 9,687,653 207,489 2.14 18.34 81.71
42. Kentucky 4,339,367 75,208 1.73 7.36 77.20
43. New Hampshire 1,316,470 21,382 1.62 6.53 61.81
44. Michigan 9,883,640 230,319 2.33 -0.55 19.70
45. Massachusetts 6,547,629 172,003 2.63 3.13 17.81
46. Rhode Island 1,052,567 34,787 3.30 0.41 23.14
47. South Carolina 4,625,364 79,935 1.73 15.29 100.09
48. West Virginia 1,852,994 27,142 1.46 2.47 71.92
49. New York 19,378,102 585,849 3.02 2.12 -0.73
50. Puerto Rico 3,725,789 122,246 3.28 -2.17 -22.83
51. Maine 1,328,361 20,941 1.58 4.19 65.58
52. District of Columbia 601,723 17,316 2.88 5.19 71.92
Total (with Puerto Rico) 312,471,327 9,026,389 2.89 9.55 29.23
U.S. Population 308,745,538 9,009,073 2.92 9.71 31.98

Tables compiled by Steven F. Riley. Source: United States Census Bureau

2000 Census Data for “Two or More Races” for States Above
# State Total Population Two or More Races (TOMR) Percentage
1. Louisiana 4,469,976 48,265 1.08
2. Mississippi 2,844,658 20,021 0.74
3. New Jersey 8,414,250 213,755 2.54
4. Virginia 7,078,515 143,069 2.02
5. Maryland 5,296,486 103,587 1.96
6. Arkansas 2,673,400 35,744 1.34
7. Iowa 2,926,324 31,778 1.09
8. Indiana 6,080,485 75,672 1.24
9. Vermont 608,827 7,335 1.20
10. Illinois 12,419,293 235,016 1.89
11. Oklahoma 3,450,654 155,985 4.52
12. South Dakota 754,844 10,156 1.35
13. Texas 20,851,820 514,633 2.47
14. Washington 5,894,121 213,519 3.62
15. Oregon 3,421,399 104,745 3.06
16. Colorado 4,301,261 122,187 2.84
17. Utah 2,233,169 47,195 2.11
18. Nevada 1,998,257 76,428 3.82
19. Missouri 5,595,211 82,061 1.47
20. Alabama 4,447,100 44,179 0.99
21. Hawaii 1,211,537 259,343 21.41
22. Nebraska 1,711,263 23,953 1.40
23. North Carolina 8,049,313 103,260 1.28
24. Delaware 783,600 13,033 1.66
25. Kansas 2,688,418 56,496 2.10
26. Wyoming 493,782 8,883 1.80
27. California 33,871,648 1,607,646 4.75
28. Ohio 11,353,140 157,885 1.39
29. Connecticut 3,405,565 74,848 2.20
30. Pennsylvania 12,281,054 142,224 1.16
31. Wisconsin 5,363,675 66,895 1.25
32. Arizona 5,130,632 146,526 2.86
33. Idaho 1,293,953 25,609 1.98
34. New Mexico 1,819,046 66,327 3.65
35. Montana 902,195 15,730 1.74
36. Tennessee 5,689,283 63,109 1.11
37. North Dakota 642,200 7,398 1.15
38. Minnesota 4,919,479 82,742 1.68
39. Alaska 626,932 34,146 5.45
40. Florida 15,982,378 376,315 2.35
41. Georgia 8,186,453 114,188 1.39
42. Kentucky 4,041,769 42,443 1.05
43. New Hampshire 1,235,786 13,214 1.07
44. Michigan 9,938,444 192,416 1.94
45. Massachusetts 6,349,097 146,005 2.30
46. Rhode Island 1,048,319 28,251 2.69
47. South Carolina 4,012,012 39,950 1.00
48. West Virginia 1,808,344 15,788 0.87
49. New York 18,976,457 590,182 3.11
50. Puerto Rico 3,808,610 158,415 4.16
51. Maine 1,274,923 12,647 0.99
52. District of Columbia 572,059 13,446 2.35
Total (with Puerto Rico) 285,230,516 6,984,643 2.45
  United States 281,421,906 6,826,228 2.43

Tables compiled by Steven F. Riley.  Source: United States Census Bureau

Tags: , , , , , , , , , , , , , , , , , , , , , , , , , , , , , , , , , , , , , , , , , , , , , , ,

Forsaking All Others: A True Story of Interracial Sex and Revenge in the 1880s South

Posted in Books, History, Law, Media Archive, Monographs, United States on 2010-08-20 16:09Z by Steven

Forsaking All Others: A True Story of Interracial Sex and Revenge in the 1880s South

University of Tennessee Press
2010-11-10
160 estimated pages
Cloth ISBN: 978-1-57233-724-4; 1572337249
Ebook ISBN: 978-1-57233-740-4; 1-57233-740-0

Charles F. Robinson, Vice Provost for Diversity; Associate Professor of History and Director of African American Studies
University of Arkansas

The electronic book (E-Book) is available now.

An intensely dramatic true story, Forsaking All Others recounts the fascinating case of an interracial couple who attempted—in defiance of society’s laws and conventions—to formalize their relationship in the post-Reconstruction South. It was an affair with tragic consequences, one that entangled the protagonists in a miscegenation trial and, ultimately, a desperate act of revenge.

From the mid-1870s to the early 1880s, Isaac Bankston was the proud sheriff of Desha County, Arkansas, a man so prominent and popular that he won five consecutive terms in office. Although he was married with two children, around 1881 he entered into a relationship with Missouri Bradford, an African American woman who bore his child. Some two years later, Missouri and Isaac absconded to Memphis, hoping to begin a new life there together. Although Tennessee lawmakers had made miscegenation a felony, Isaac’s dark complexion enabled the couple to apply successfully for a marriage license and take their vows. Word of the marriage quickly spread, however, and Missouri and Isaac were charged with unlawful cohabitation. An attorney from Desha County, James Coates, came to Memphis to act as special prosecutor in the case. Events then took a surprising turn as Isaac chose to deny his white heritage in order to escape conviction. Despite this victory in court, however, Isaac had been publicly disgraced, and his sense of honor propelled him into a violent confrontation with Coates, the man he considered most responsible for his downfall.

Charles F. Robinson uses Missouri and Isaac’s story to examine key aspects of post-Reconstruction society, from the rise of miscegenation laws and the particular burdens they placed on anyone who chose to circumvent them, to the southern codes of honor that governed both social and individual behavior, especially among white men. But most of all, the book offers a compelling personal narrative with important implications for our supposedly more tolerant times.

Tags: , , , , , ,

Fixing the Color Line: The Mulatto, Southern Courts, and Racial Identity

Posted in Articles, History, Identity Development/Psychology, Law, Media Archive, Slavery, United States on 2010-03-08 19:36Z by Steven

Fixing the Color Line: The Mulatto, Southern Courts, and Racial Identity

American Quarterly
Volume 53, Number 3 (September 2001)
pages 420-451
E-ISSN: 1080-6490
Print ISSN: 0003-0678
DOI: 10.1353/aq.2001.0033

Teresa Zackodnik, Professor of English
University of Alberta, Canada

In July 1857 Abby Guy sued for her freedom and that of her four children in an Arkansas court. The court records state that Abby Guy had been supporting herself and her children by farming and selling her own crops. The Guy family “passed as free persons”: Abby’s oldest daughter “boarded out” so that she could attend school, and the family “visited among white folks, and went to church, parties, etc.,–[such that one] should suppose they were white.”  Following these accounts of where and how the Guys lived, the court required that the family be presented for physical inspection by the jury, which was to base its decision of whether Abby Guy and her children were black or white, slave or free, on their appearance as well as on any testimony offered: “Here the plaintiffs were personally presented in Court, and the judge informed the jury that they… should treat their… inspection of plaintiffs’ persons as evidence.”  Following their evidentiary “inspection” of the Guy family, the jury was told that the Guys had lived as “free persons” in Arkansas since 1844. In 1855 they moved to Louisiana where a Mr. Daniel “took possession of them as slaves” roughly two years later, claiming that Abby Guy “came with . . . [him] from Alabama to Arkansas” as his slave.  Witnesses for Daniel testified that Abby’s mother, Polly, was said to have been “a shade darker than Abby,” such that they “could not say whether Polly was of African or Indian extraction.”…

Read or purchase the article here.

Tags: , , , ,